Course description

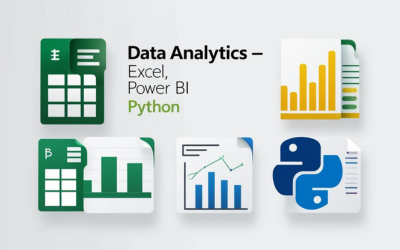
This course is designed to equip you with practical skills in data analysis using the most in-demand tools in the industry. You will learn how to work with datasets, clean and transform data, draw insights, and present visual reports using tools like Excel, SQL, Power BI, and Python.

Whether you're a beginner or transitioning into analytics, this course includes hands-on projects, case studies, and real-world business scenarios. By the end, you’ll be able to apply for roles such as Data Analyst, Business Analyst, or Reporting Analyst with confidence.


Course Curriculum

Module 1: Introduction to Data Analytics

  • What is data analytics?

  • Types of analytics: Descriptive, Diagnostic, Predictive, Prescriptive

  • Data analytics lifecycle


Module 2: Data Handling in Excel

  • Excel formulas and functions

  • PivotTables and charts

  • Data validation and conditional formatting

  • Dashboards and data visualization


Module 3: SQL for Data Analysis

  • Database concepts and ER diagrams

  • Writing basic to advanced SQL queries

  • Joins, subqueries, aggregation

  • Data extraction and reporting with SQL


Module 4: Data Visualization with Power BI

  • Power BI interface and workspace

  • Data import, transformation, and cleaning

  • Creating interactive dashboards

  • DAX functions and calculated fields


Module 5: Python for Data Analytics

  • Python basics (variables, functions, loops)

  • Pandas and NumPy for data manipulation

  • Data visualization with Matplotlib and Seaborn

  • Exploratory Data Analysis (EDA)


Module 6: Working with Business Data

  • Real-world datasets (sales, marketing, finance)

  • KPI analysis and dashboards

  • Business storytelling with data

  • Case study: End-to-end project with Power BI and Python


Module 7: Data Cleaning and Preparation

  • Handling missing data

  • Outlier detection

  • Data type conversions and standardization

  • Using Power Query and Python


Module 8: Capstone Project

  • Complete a business-focused data analytics project

  • Combine Excel, SQL, Python, and Power BI

  • Present insights in a final dashboard

What will i learn?

  • Analyze and visualize data using Excel, SQL, and Power BI
  • Clean, organize, and interpret data
  • Build interactive dashboards and present business insights
  • Apply for roles like Data Analyst, Business Intelligence Analyst

Requirements

  • A computer with internet access
  • No prior coding or analytics knowledge needed
  • Microsoft Excel and Power BI Desktop (free)
  • Willingness to practice and explore real data

Frequently asked question

Only basic Python is taught, suitable for beginners.

Yes, no prior experience is required.

Yes, a certificate of completion will be issued.

Himanshu Kumar

Himanshu Kumar – Seasoned IT Professional, Technical Trainer & Mentor with 25+ Years of Experience in Training and Industry.

Himanshu Kumar is a seasoned IT professional, and dedicated technical trainer with over 25 years of industry and training experience. With a passion for empowering aspiring tech professionals, he has successfully trained and placed more than 1400 students since 2007.Specializing in areas like Linux system administration, networking, cloud technologies, and cybersecurity, Himanshu blends deep technical expertise with real-world insights to deliver hands-on, career-focused training. His mentoring approach is practical, personalized, and results-driven—helping students not just learn, but thrive in the IT industry.Whether you’re just starting your tech journey or aiming for professional certification, Himanshu’s guidance can help you gain the skills and confidence needed to succeed.

₹9999

₹34999

Lectures

0

Skill level

Beginner

Expiry period

12 Months

Share this course

Related courses